The Wellntel sensor is unique among water-level sensors in that it tags pumping-related measurements so that they can be used in ways important to data analysis. In the preceding Part 2 of this series, all the pumping-tagged measurements were filtered out in the example so that the non-pumping water levels - the static saturated thickness - could be highlighted.
But how does the Wellntel sensor system assign tags to measurements?
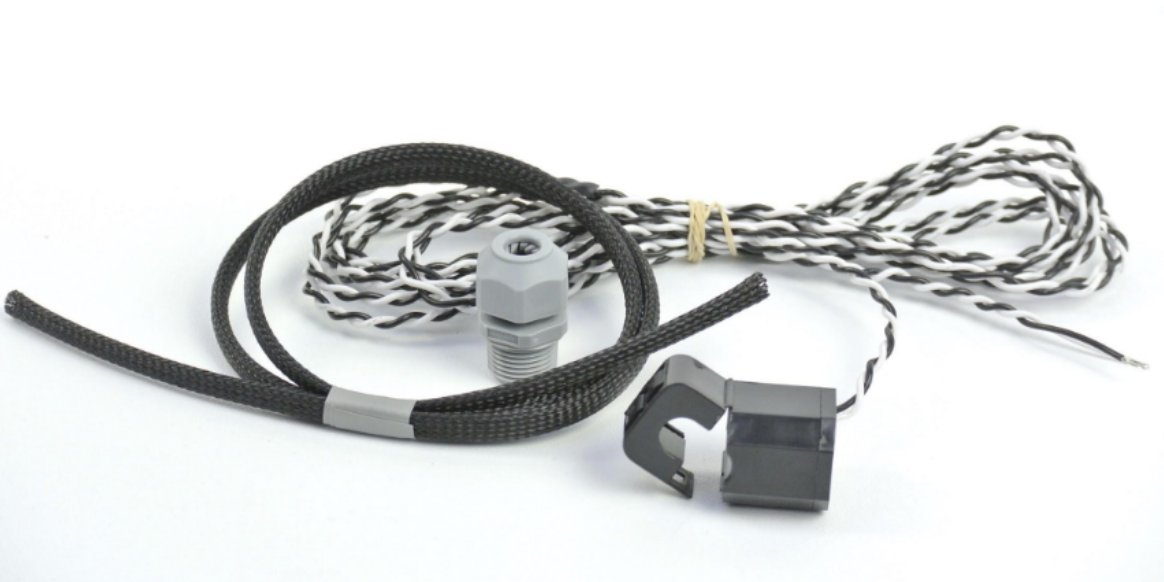
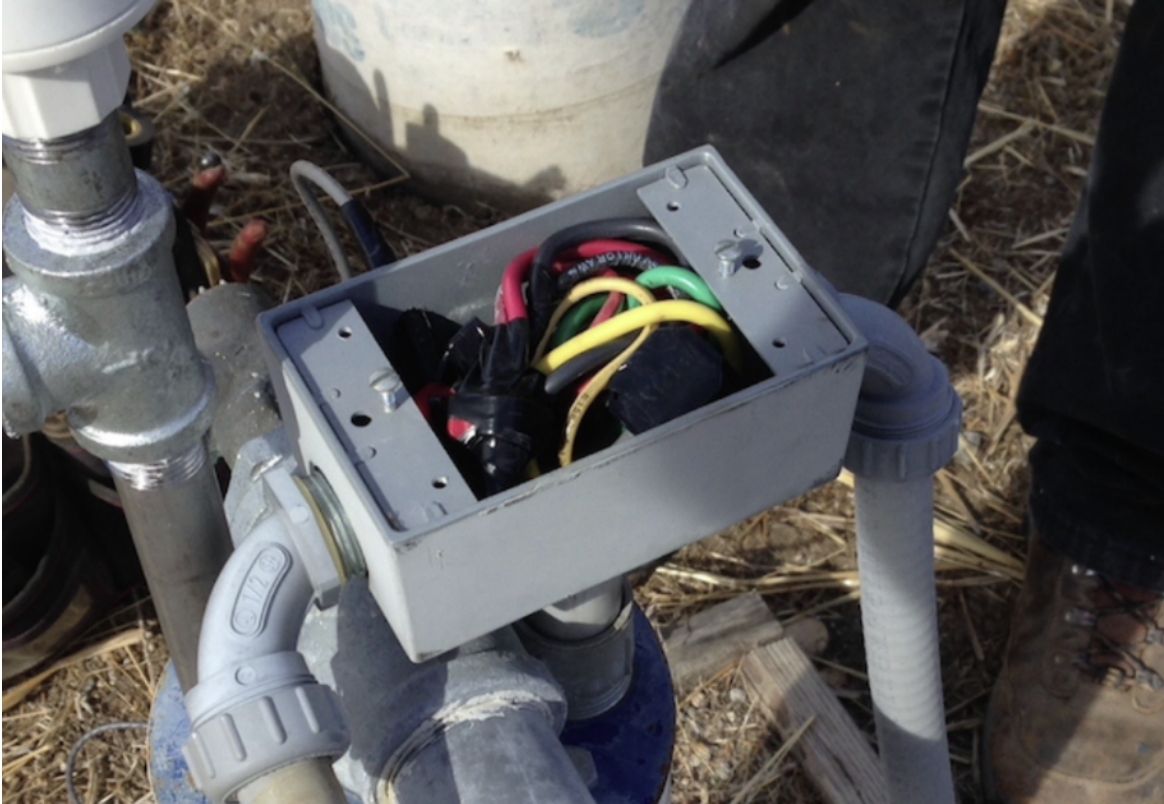
Using a current transducer that clips around the power lead to the submersible pump (Figure 1), the Wellntel sensor recognizes when pumping begins and when pumping stops, and takes a water-level measurement at the instant each occurs. And after the sensor records the measurement when pumping stops, the system will take a sequence of measurements to capture the recovery profile.
The different tags (Events) that are applied to Wellntel water-level measurements (Figure 2) are:
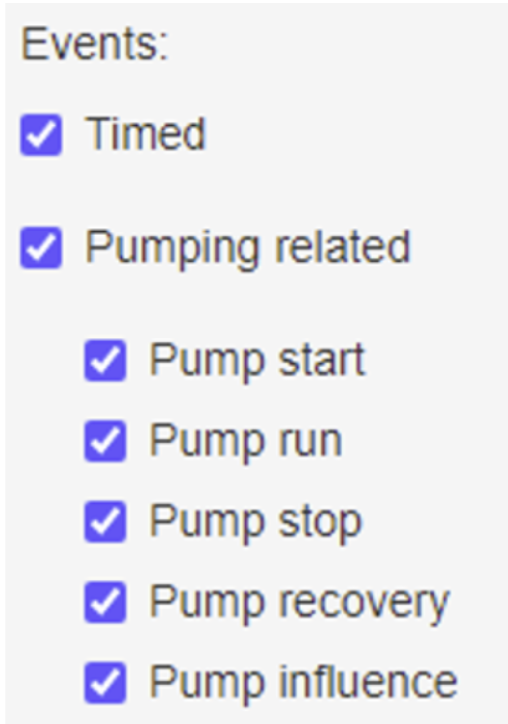
Timed water-level measurements are important in illustrating the trends of saturated thickness of the groundwater resource as illustrated in the preceding part of this series. The pumping-related measurements provide important information on the effect of pumping stress on the resource. Each measurement Event type (Figure 2) can be included or filtered out of any hydrograph or other visualization, or data download, as might be appropriate to the analysis.
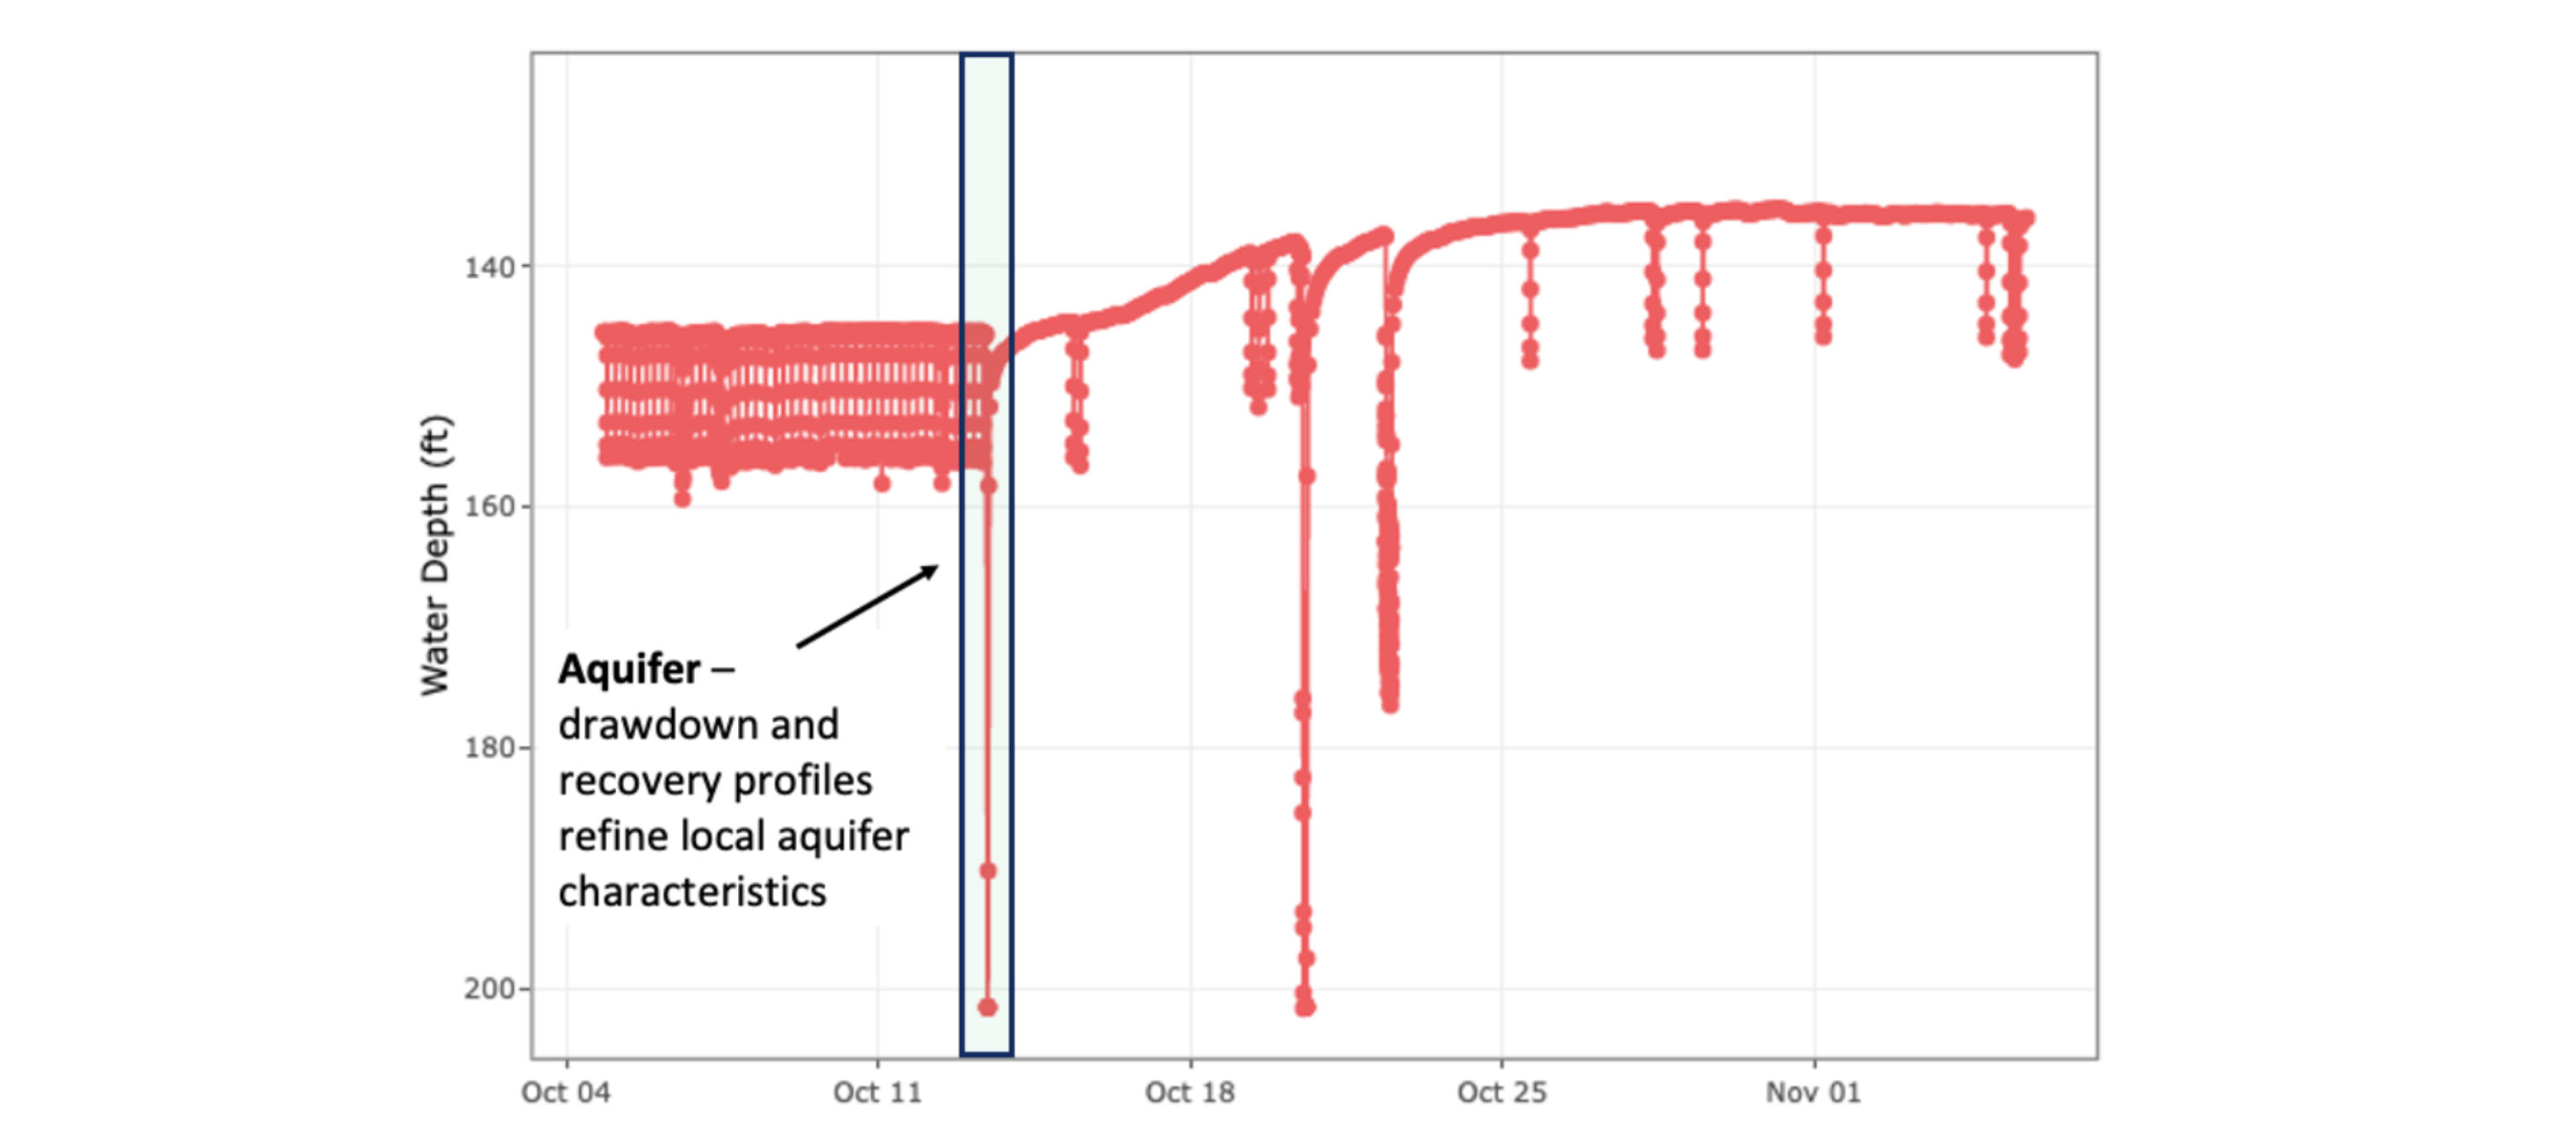
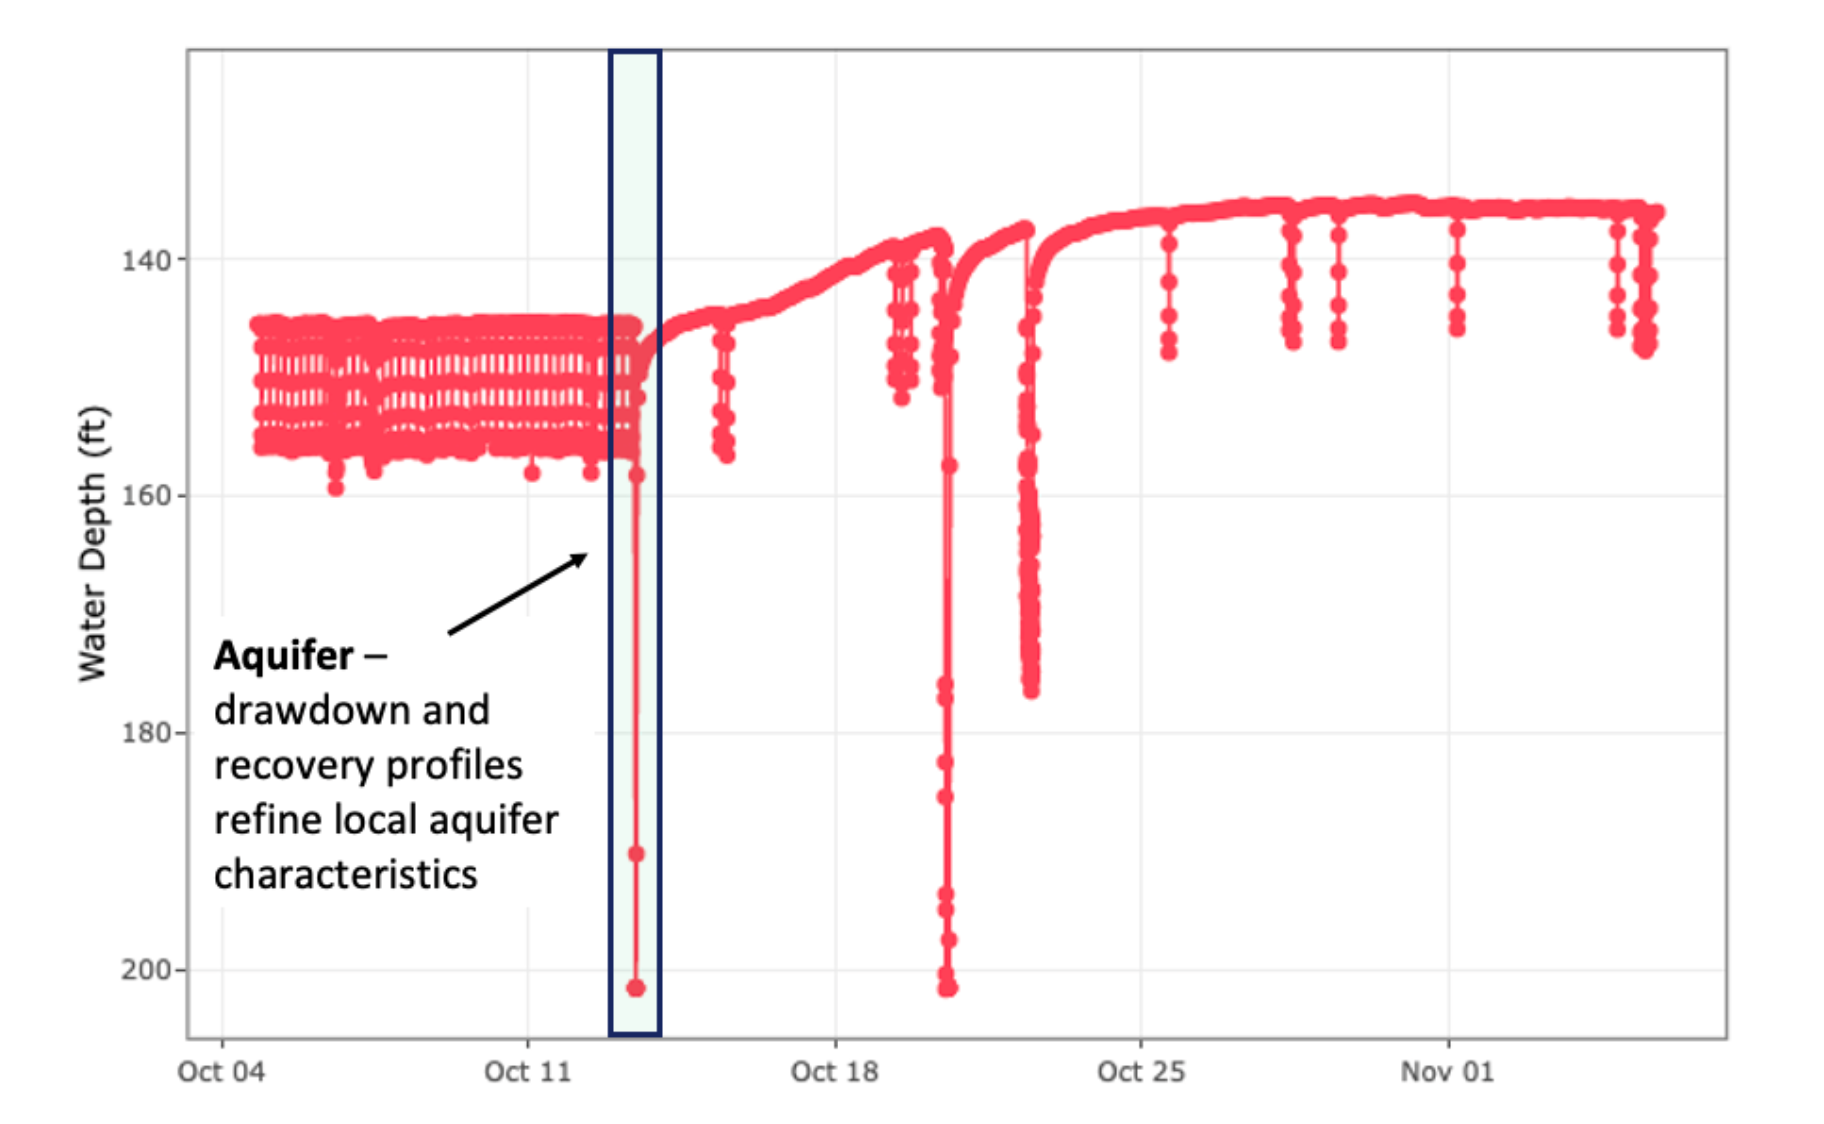
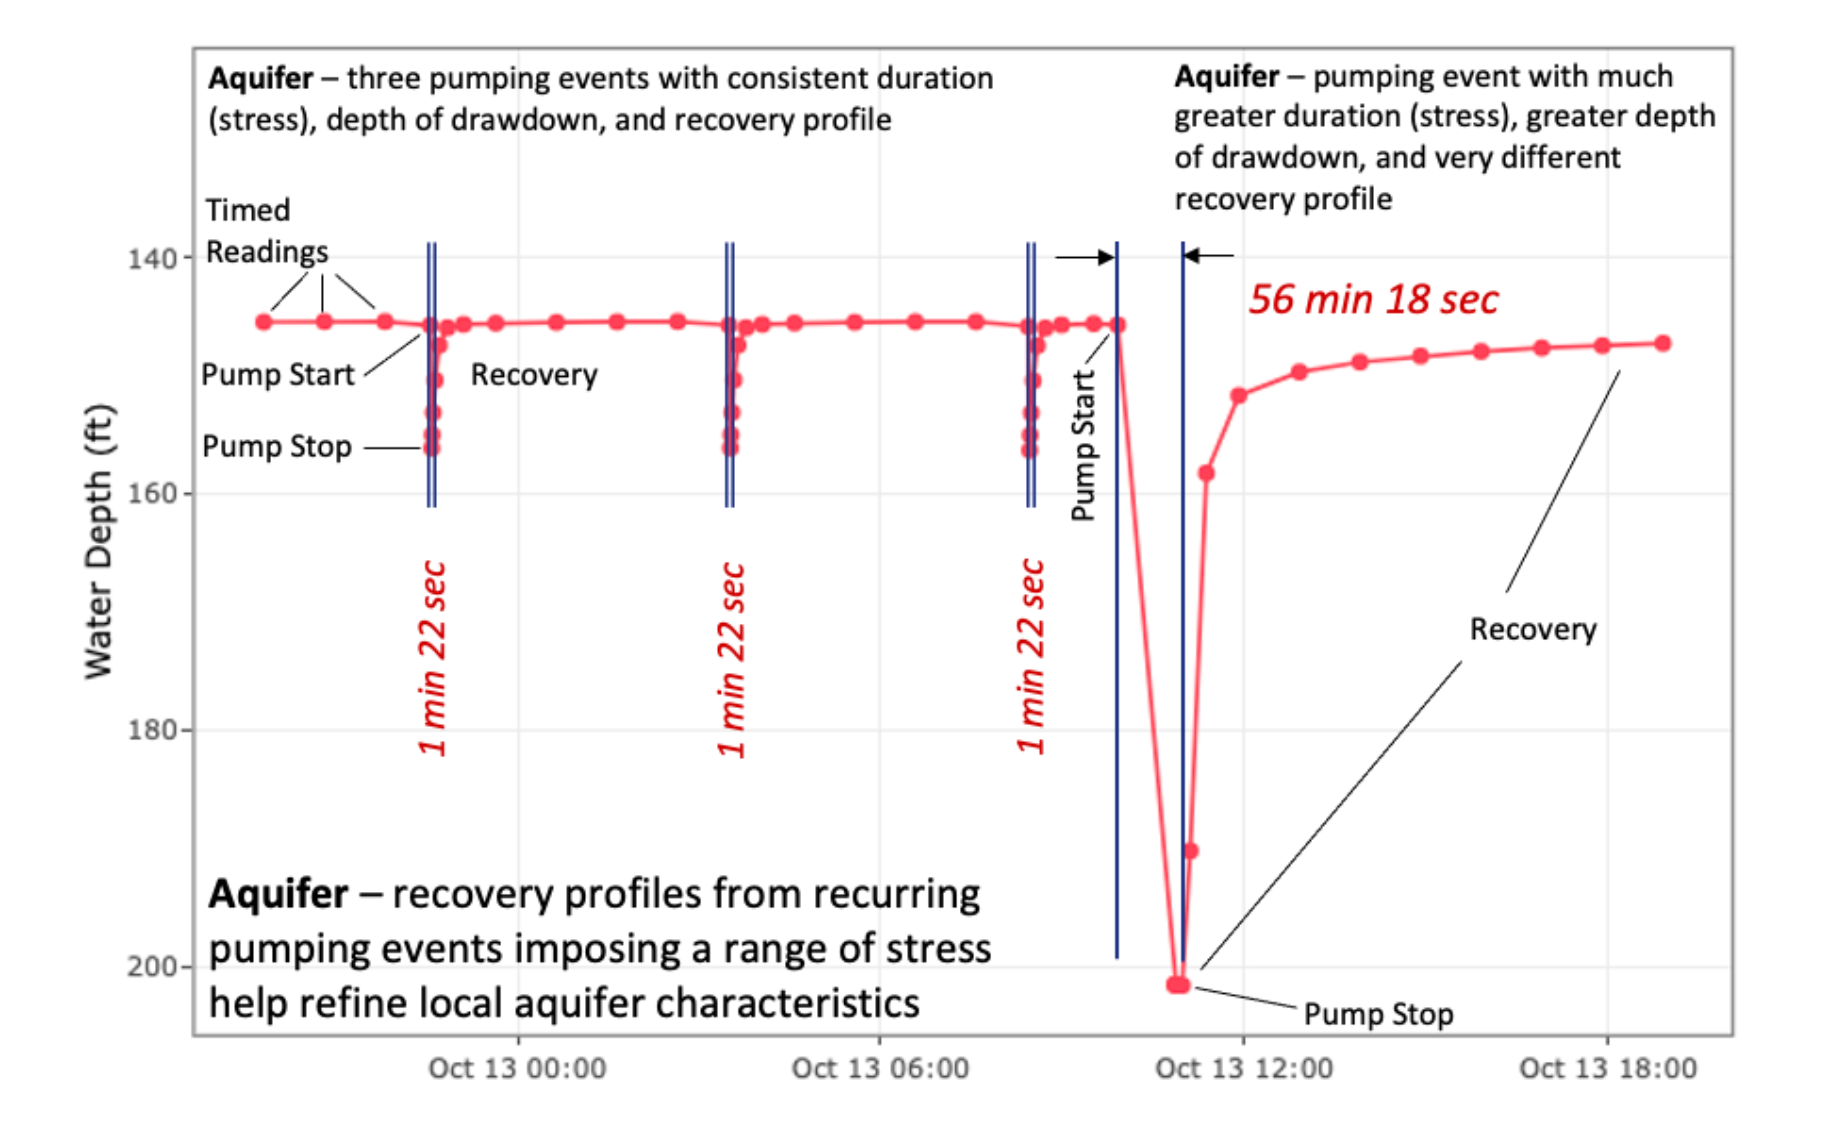
Focusing on the time interval indicated by the blue box on the hydrograph from a well in the Texas Hill Country (Figure 3) the details of several pumping events are visible (Figure 4). Timed measurements prior to pumping events are noted as are water-level measurements at Pump start, Pump stop, and Pump recovery.
As noted on Figure 4, water-level data show three pumping events in a row that are essentially identical - the same pumping duration (stress) and resulting drawdown, followed by the same recovery profile. Following these three pumping events, data show a pumping event with substantially longer pumping duration resulting in much greater pumping drawdown and a very different recovery profile. The physical characteristics of both the aquifer and the well are reflected in the response to the pumping stress.
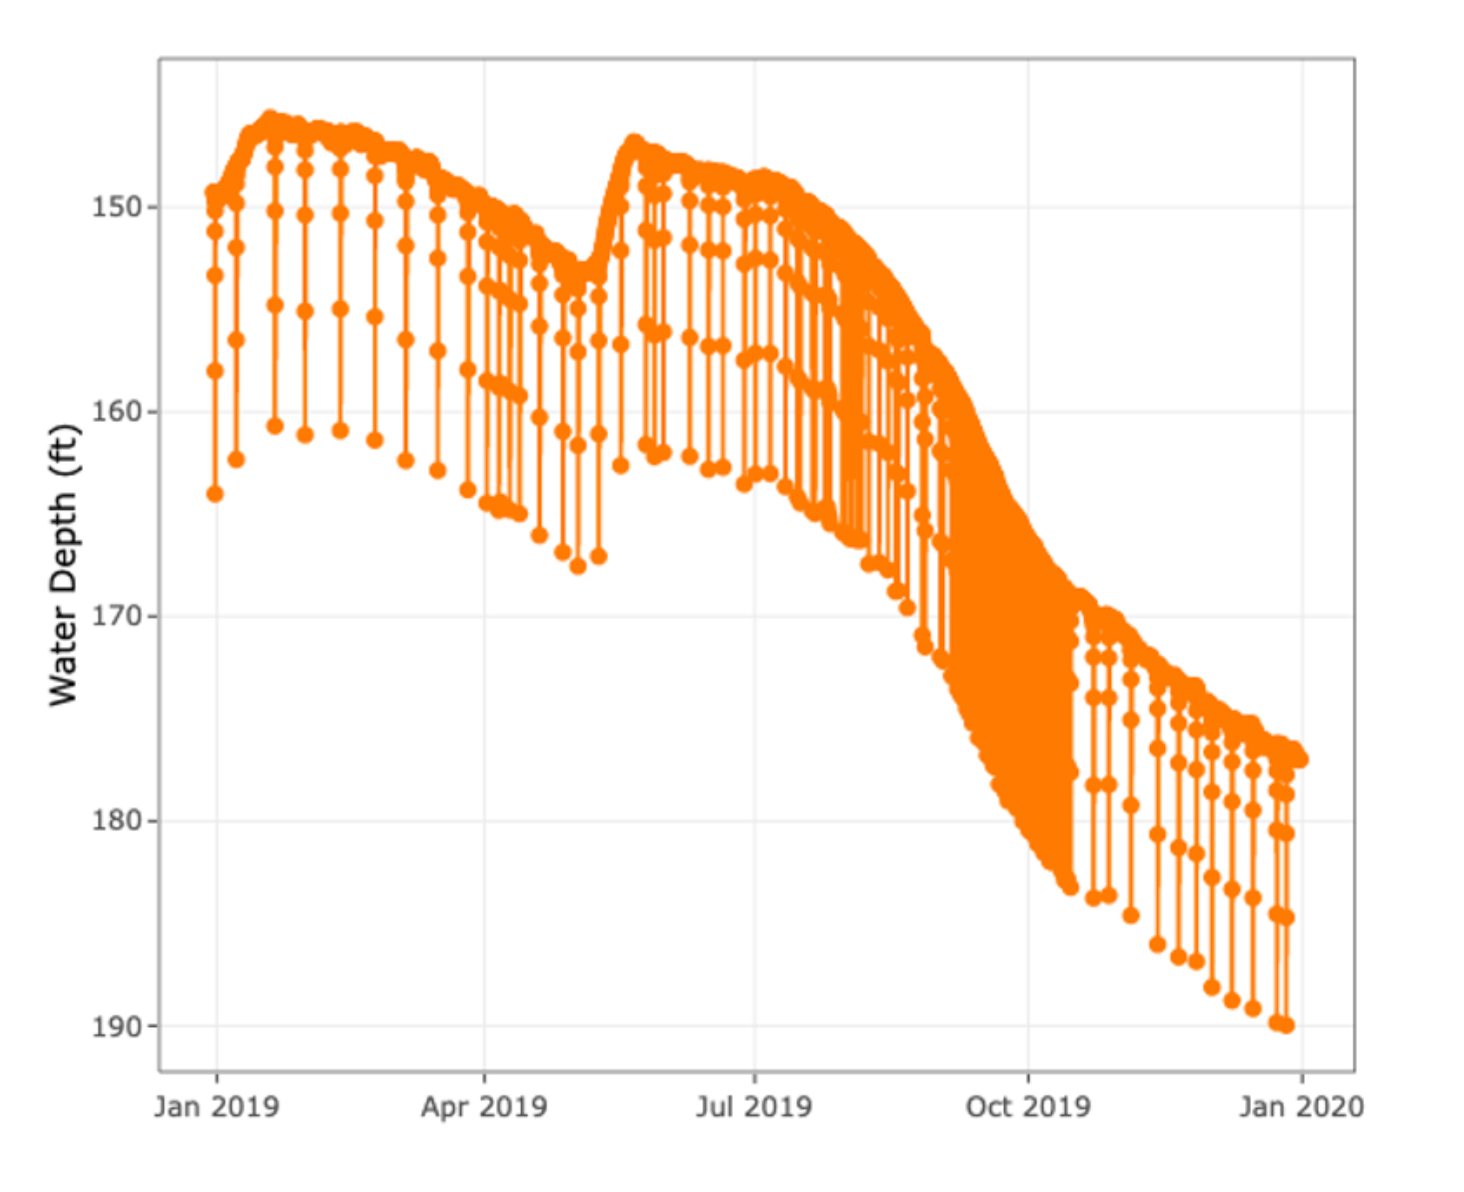
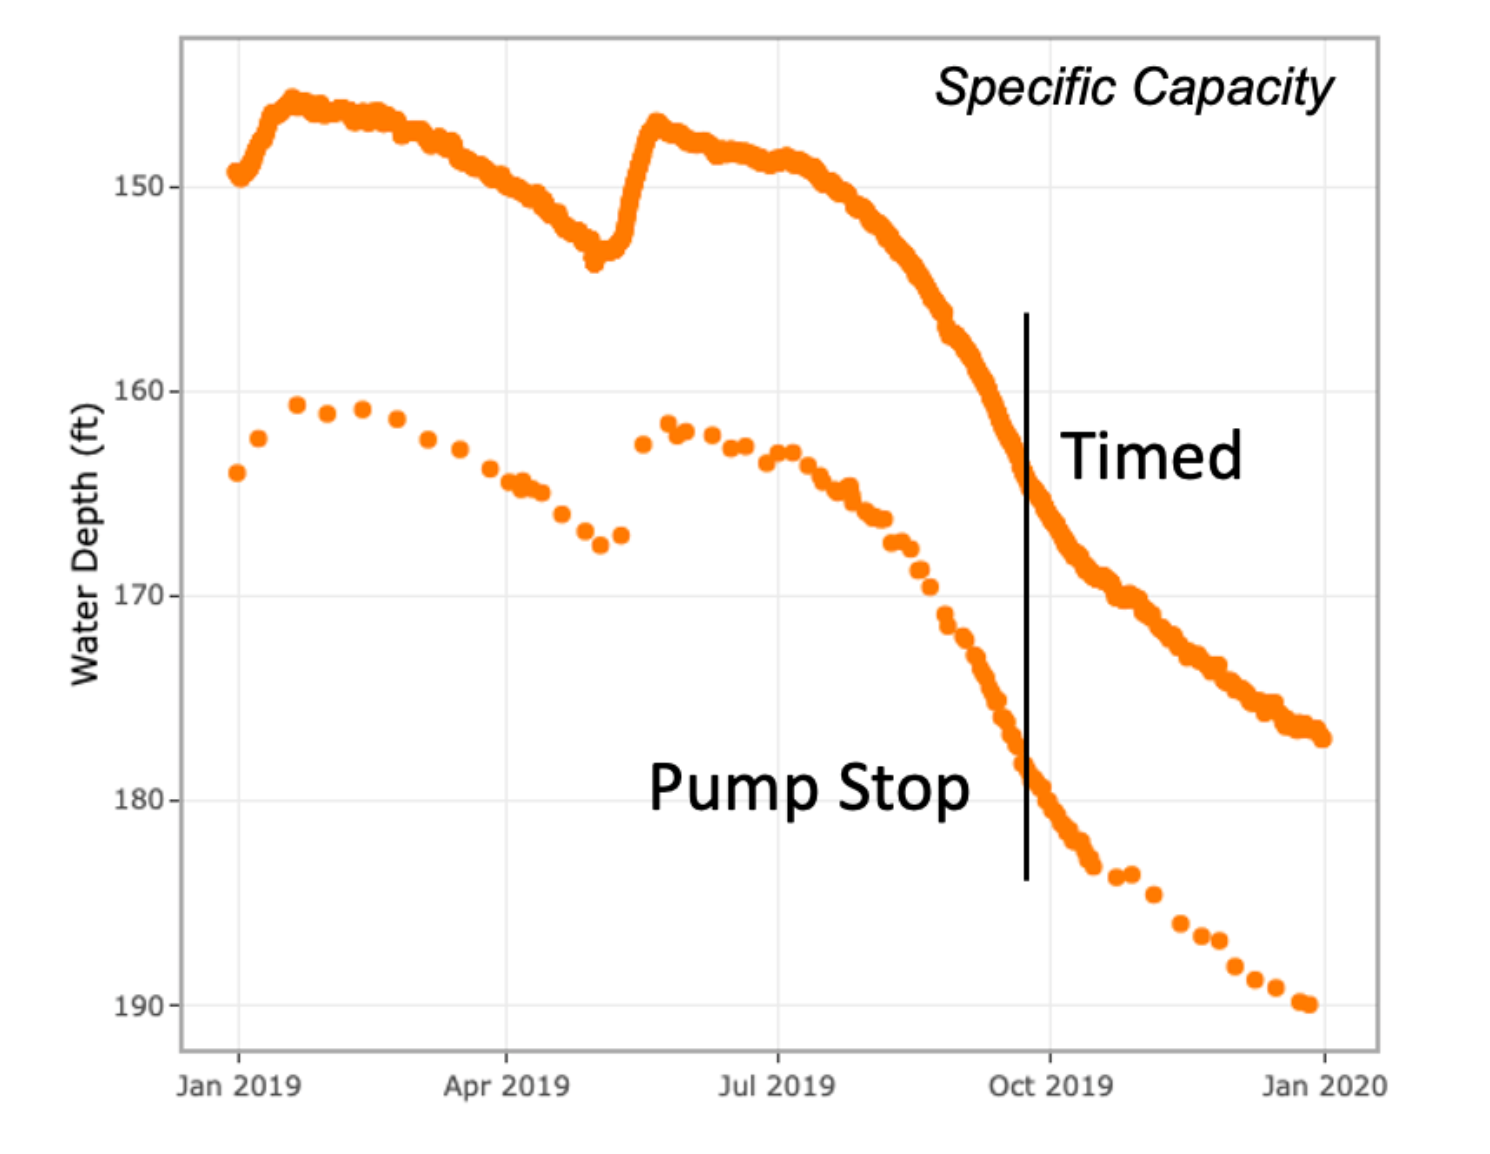
A different Texas Hill Country well demonstrates how recurring pumping events can establish the specific capacity of a well. A hydrograph representing about a year includes data of all events (Figure 5), but can be filtered to plot only the Timed and Pump Stop measurements (Figure 6). Specific capacity - the discharge rate (in gpm) divided by the water level drawdown (in feet) - can be calculated at any point along the record. The value of specific capacity integrates characteristics of both the aquifer and the well and is often tracked over time to recognize any changes to conditions in the aquifer, the well or the pump.
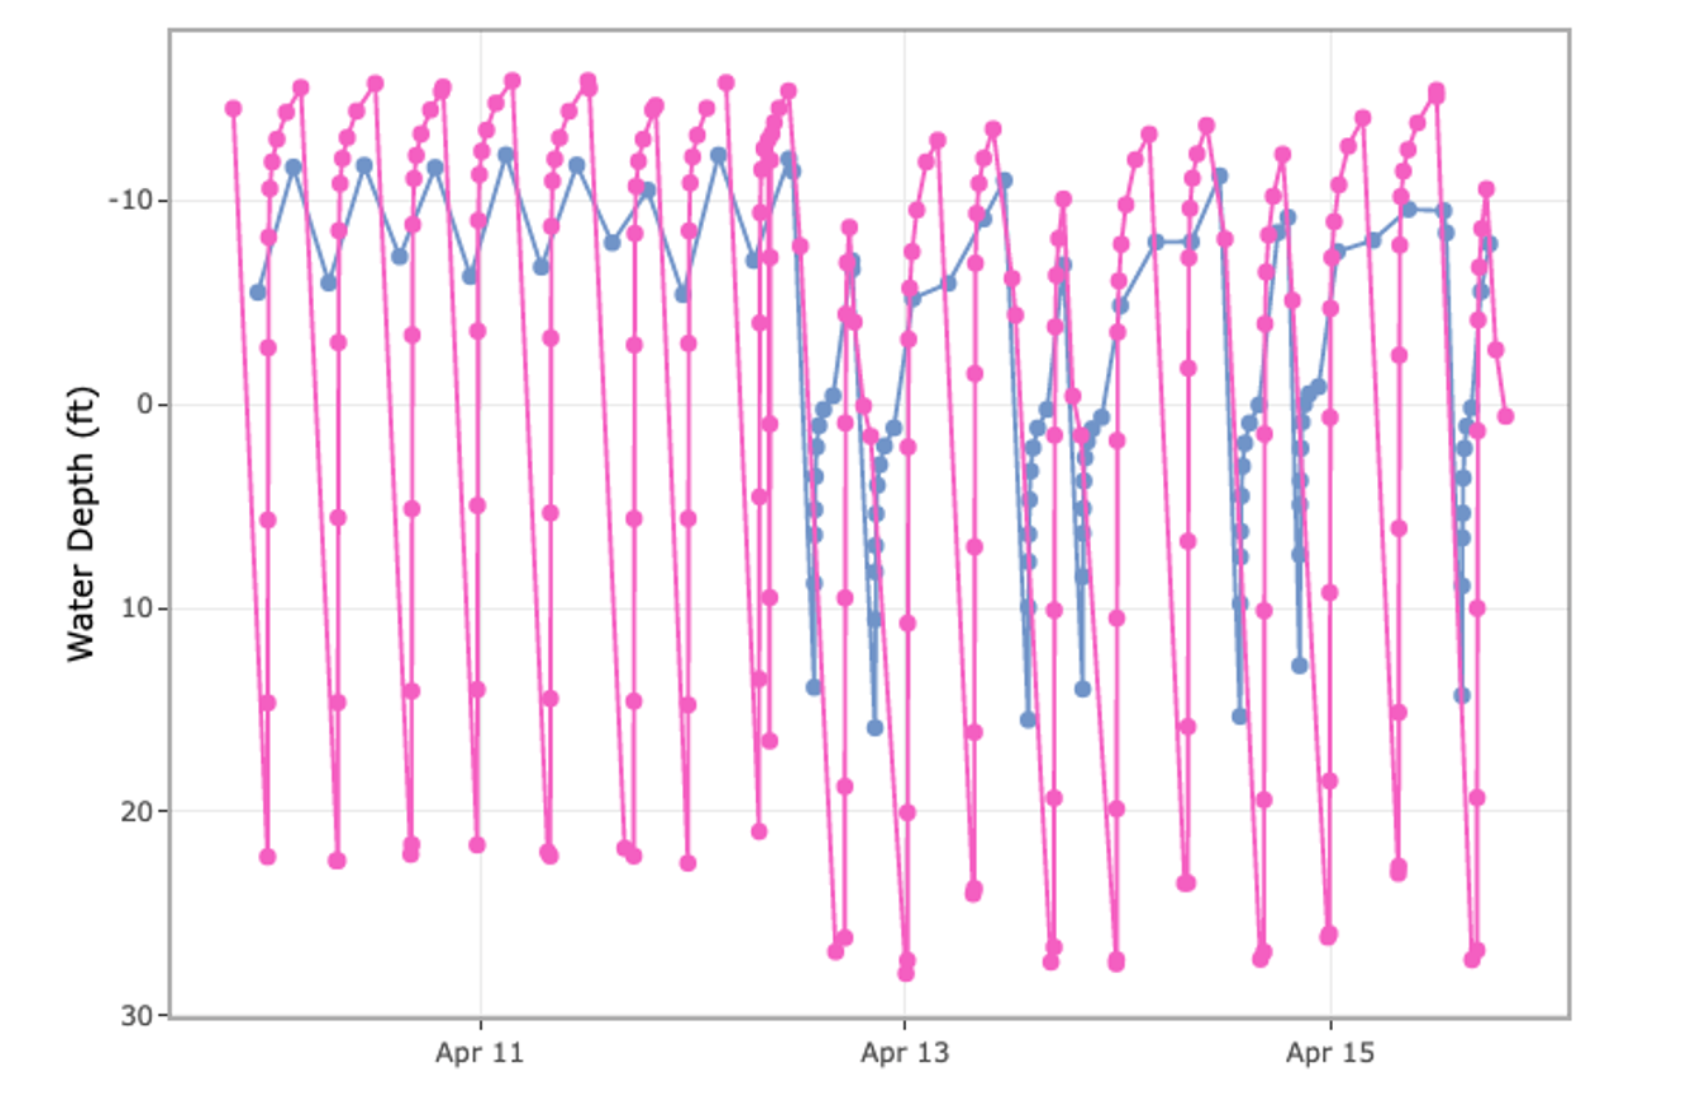
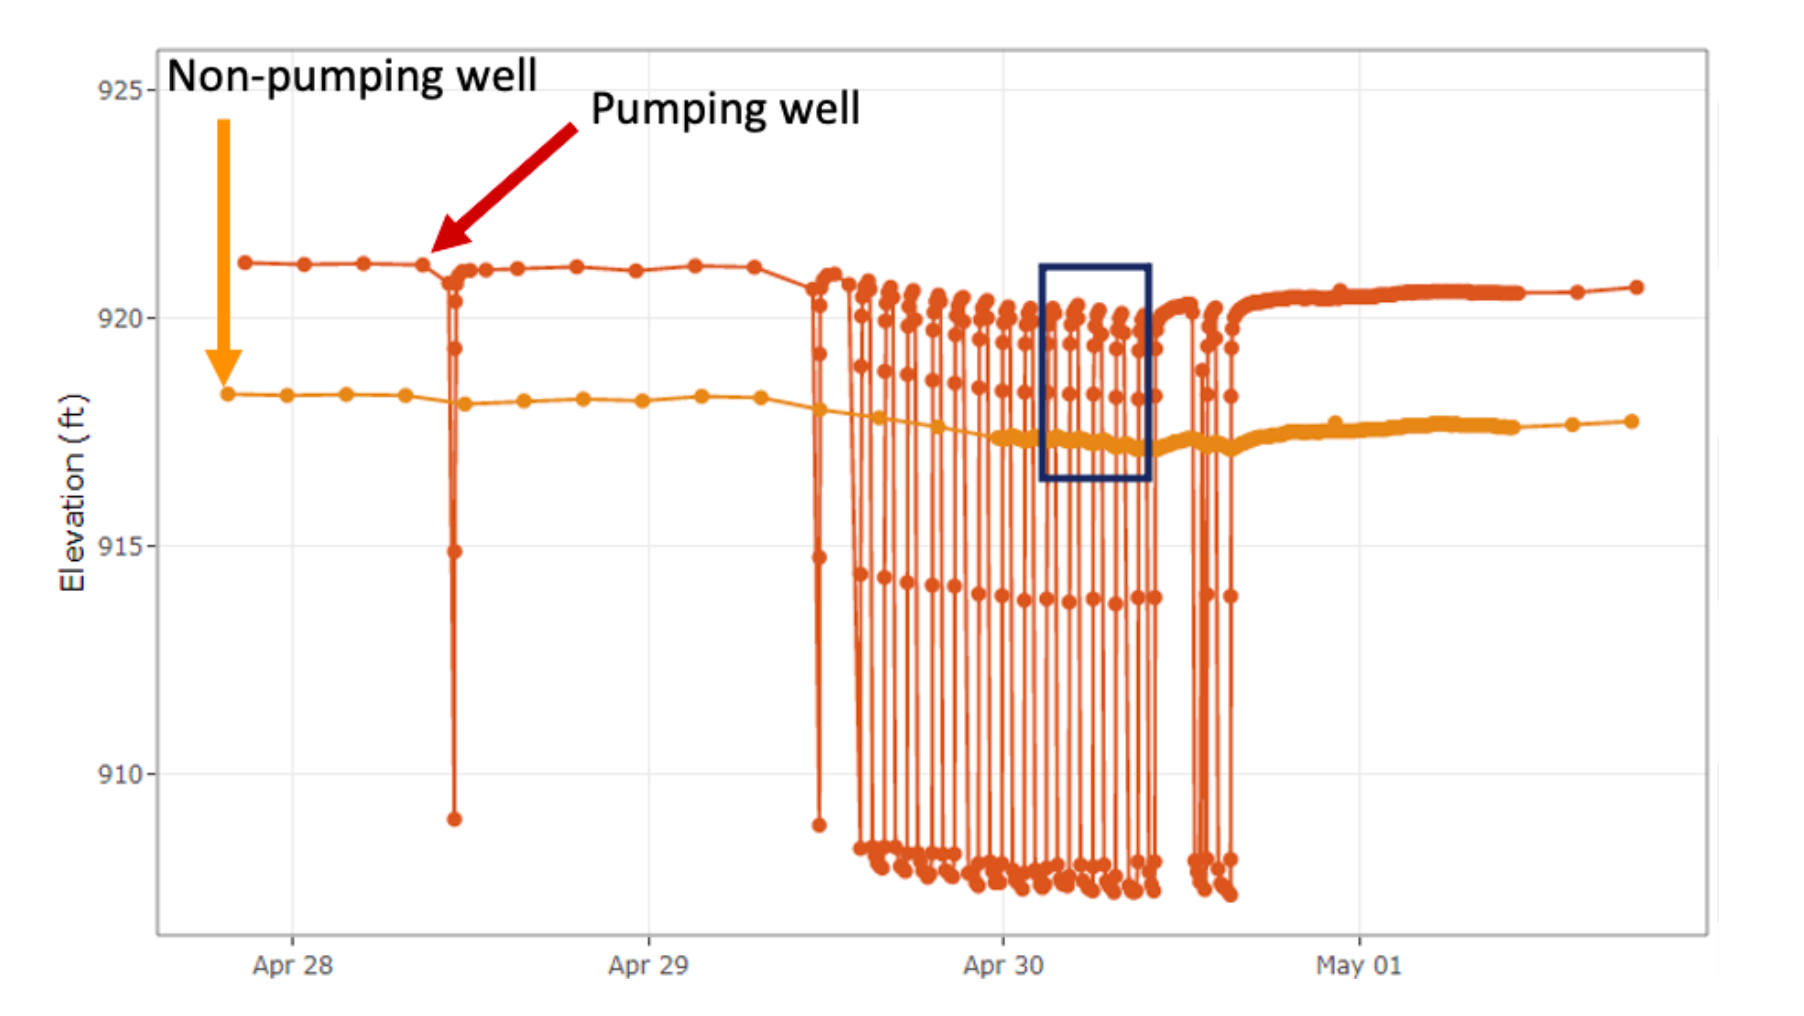
By plotting this particular Hill Country well together with a neighboring well, specific insight is gained by observing the influence of pumping of one well on the other (Figure 7). During a period of frequent pumping the overall lowering of the saturated thickness is noted in both wells in response to the stress.
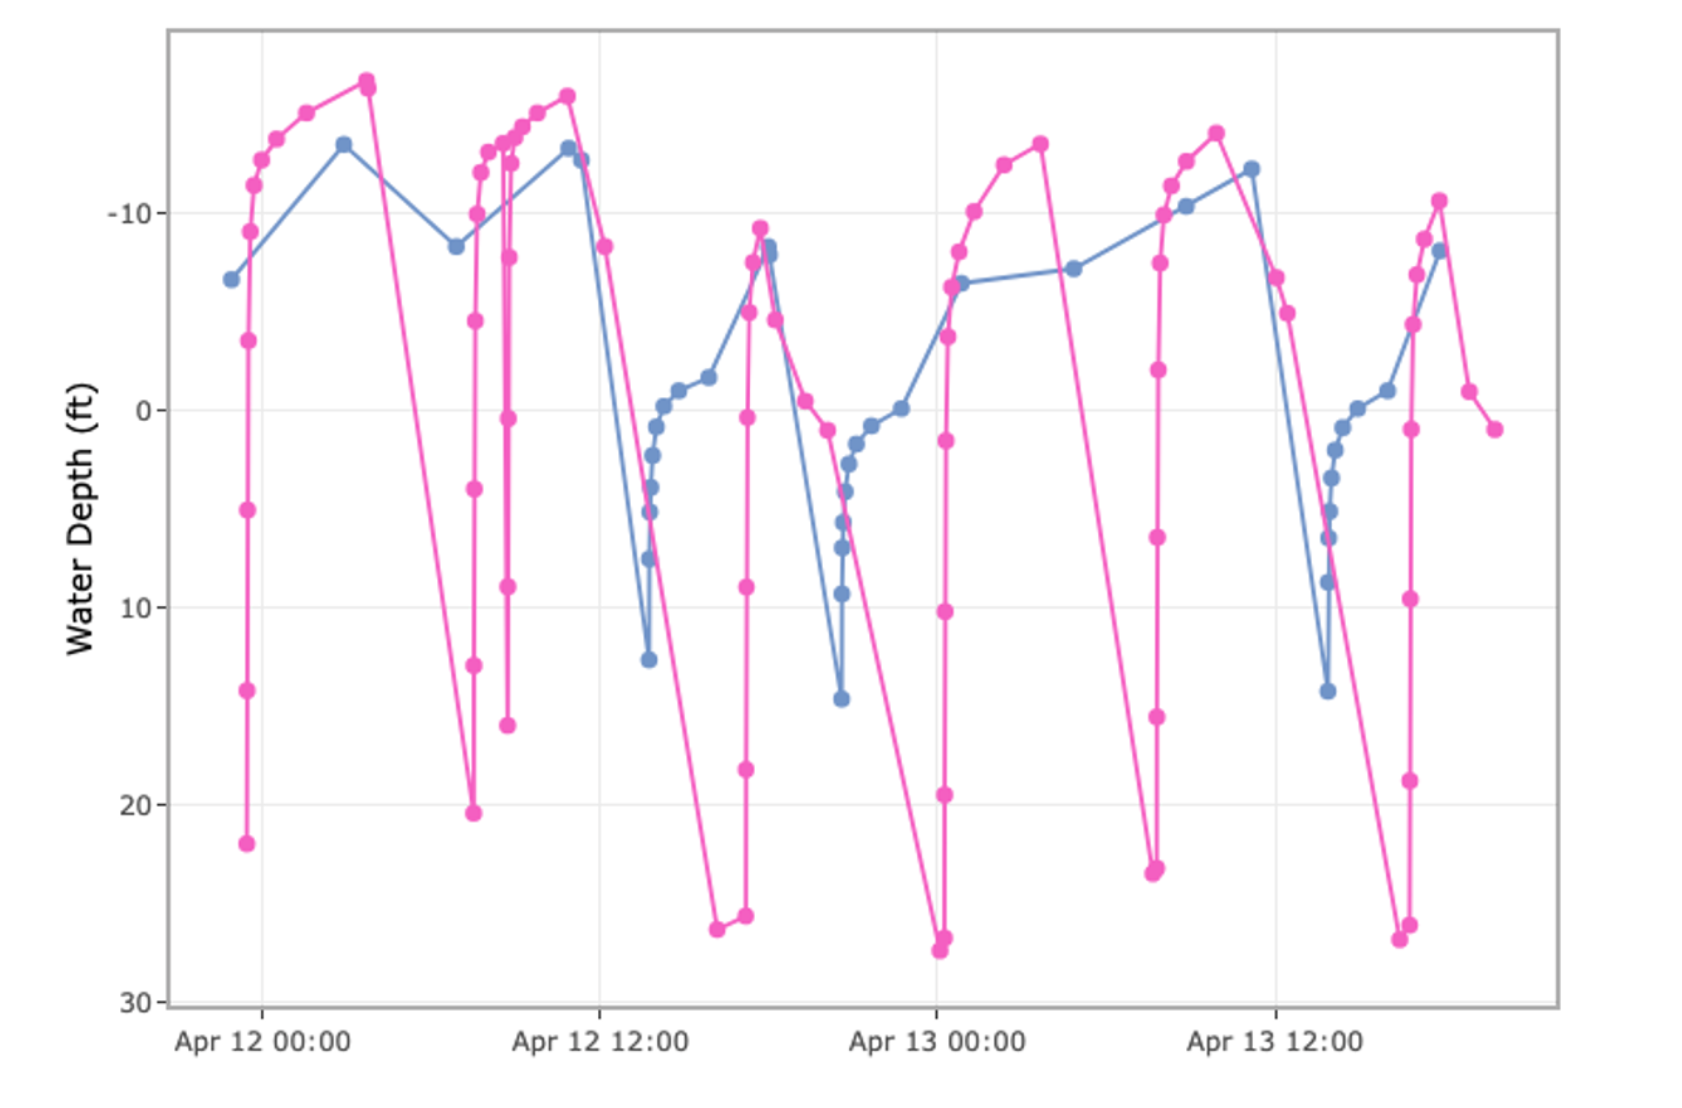
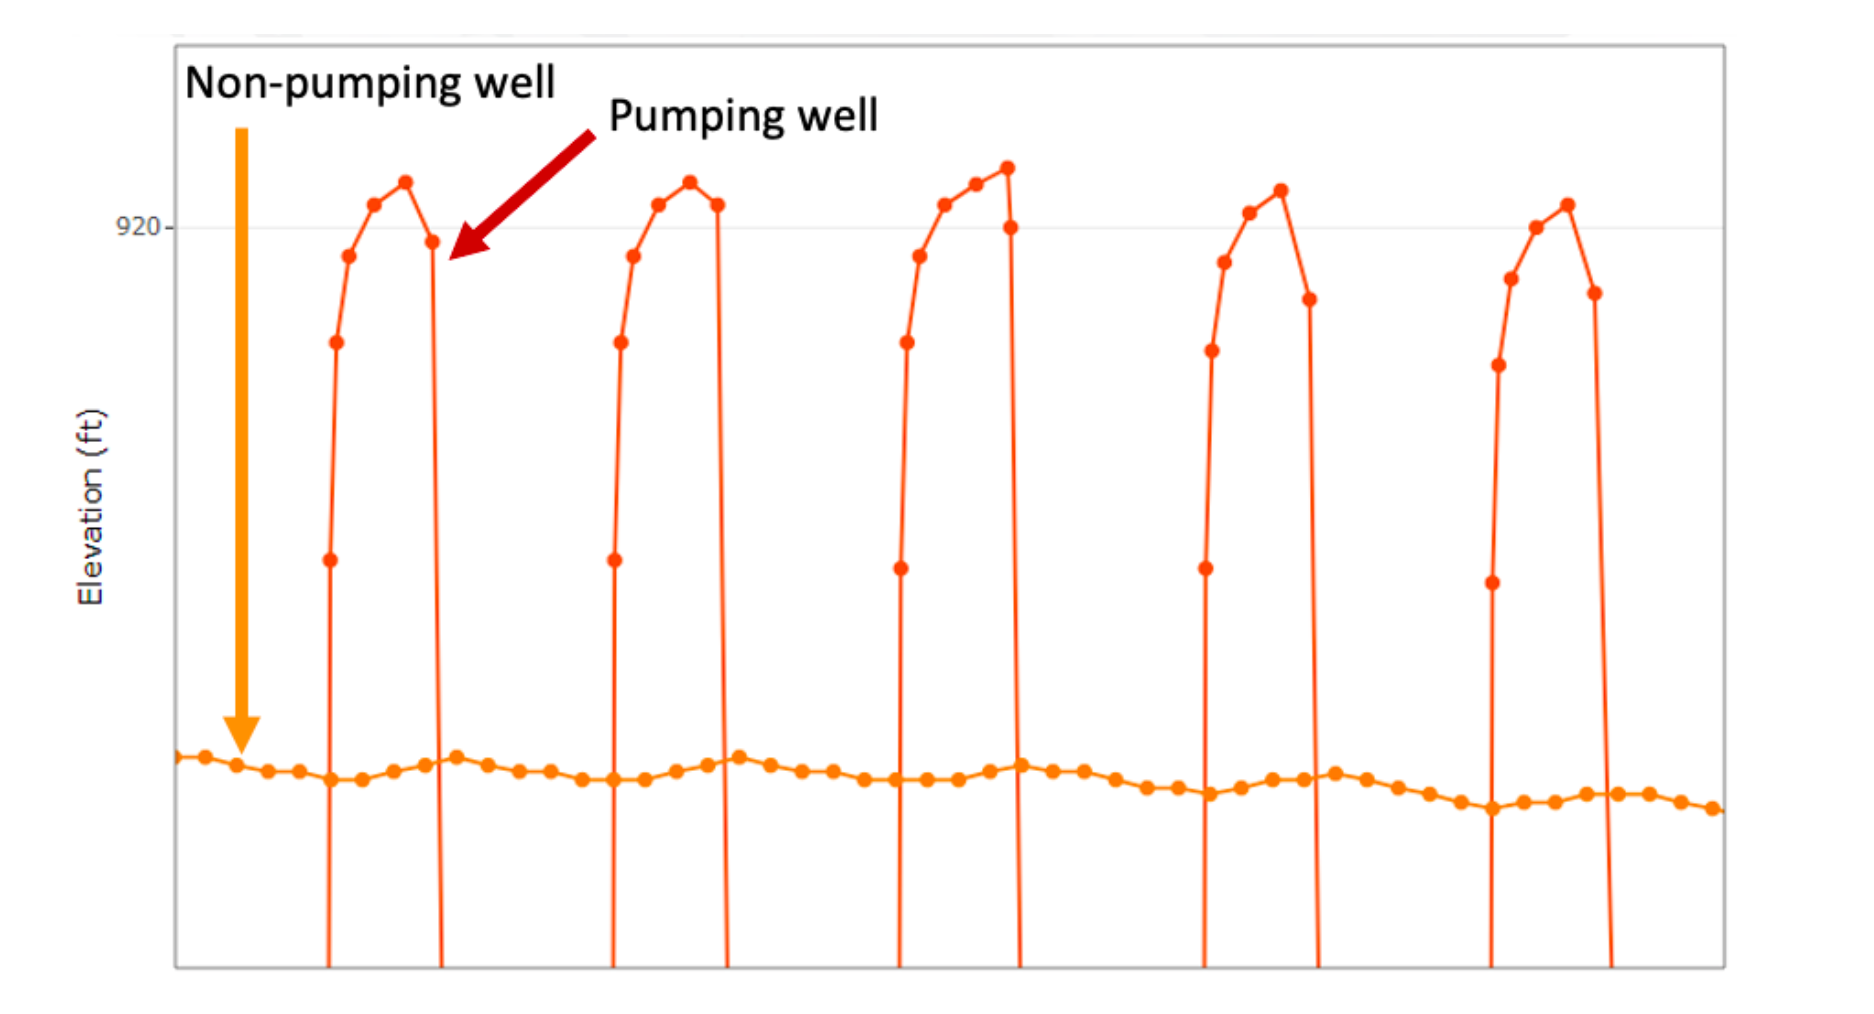
Focusing on the time interval indicated by the blue box on the hydrograph, detail is shown of the direct influence of the stress of pumping on the non-pumping monitoring well (Figure 8). When a pumping event begins, the monitoring well has a measurable downward trend in water level. When the pumping ceases, the monitoring well reverses the trend and levels recover. Because the distance between these two wells is known, as is the pumping rate (stress), data from the recovery curve can be used for estimating local hydraulic parameters of the aquifer.
A last example comes from a Concentrated Animal Feeding Operation in Northeast Wisconsin. The first portion of the hydrograph (Figure 9) is similar to the preceding example in which the influence of a pumping well is observed on the water levels in a monitoring well, and there may be an opportunity to estimate local aquifer characteristics. However, the latter portion of the hydrograph shows a period when both wells are pumping and influencing each other (Figures 9, 10). This is a much more challenging situation in which unknown well losses complicate the use of data from recovery curves for estimating aquifer characteristics.
Perhaps there are sophisticated numerical approaches that can be applied here, but there is certainly useful insight gained by seeing the pumping influence of one well on the other as the farmer works to optimize operations and protect the water supply infrastructure.
The final part in this series will continue with discussion of real time, tagged water-level data collected by Wellntel sensors providing insight into water supply infrastructure and operations, reducing resource and business risk.